High speed wind
New products, color harmonization... and more!
by Sylvain Herlédan
Faozi Said (NOAA) designed a nice colormap that makes it easy to distinguish wind speed categories and shared it with us (thanks again!), so we used it to reprocess a few products that we already had in Syntool and for processing new data that were previously missing from our catalogue.
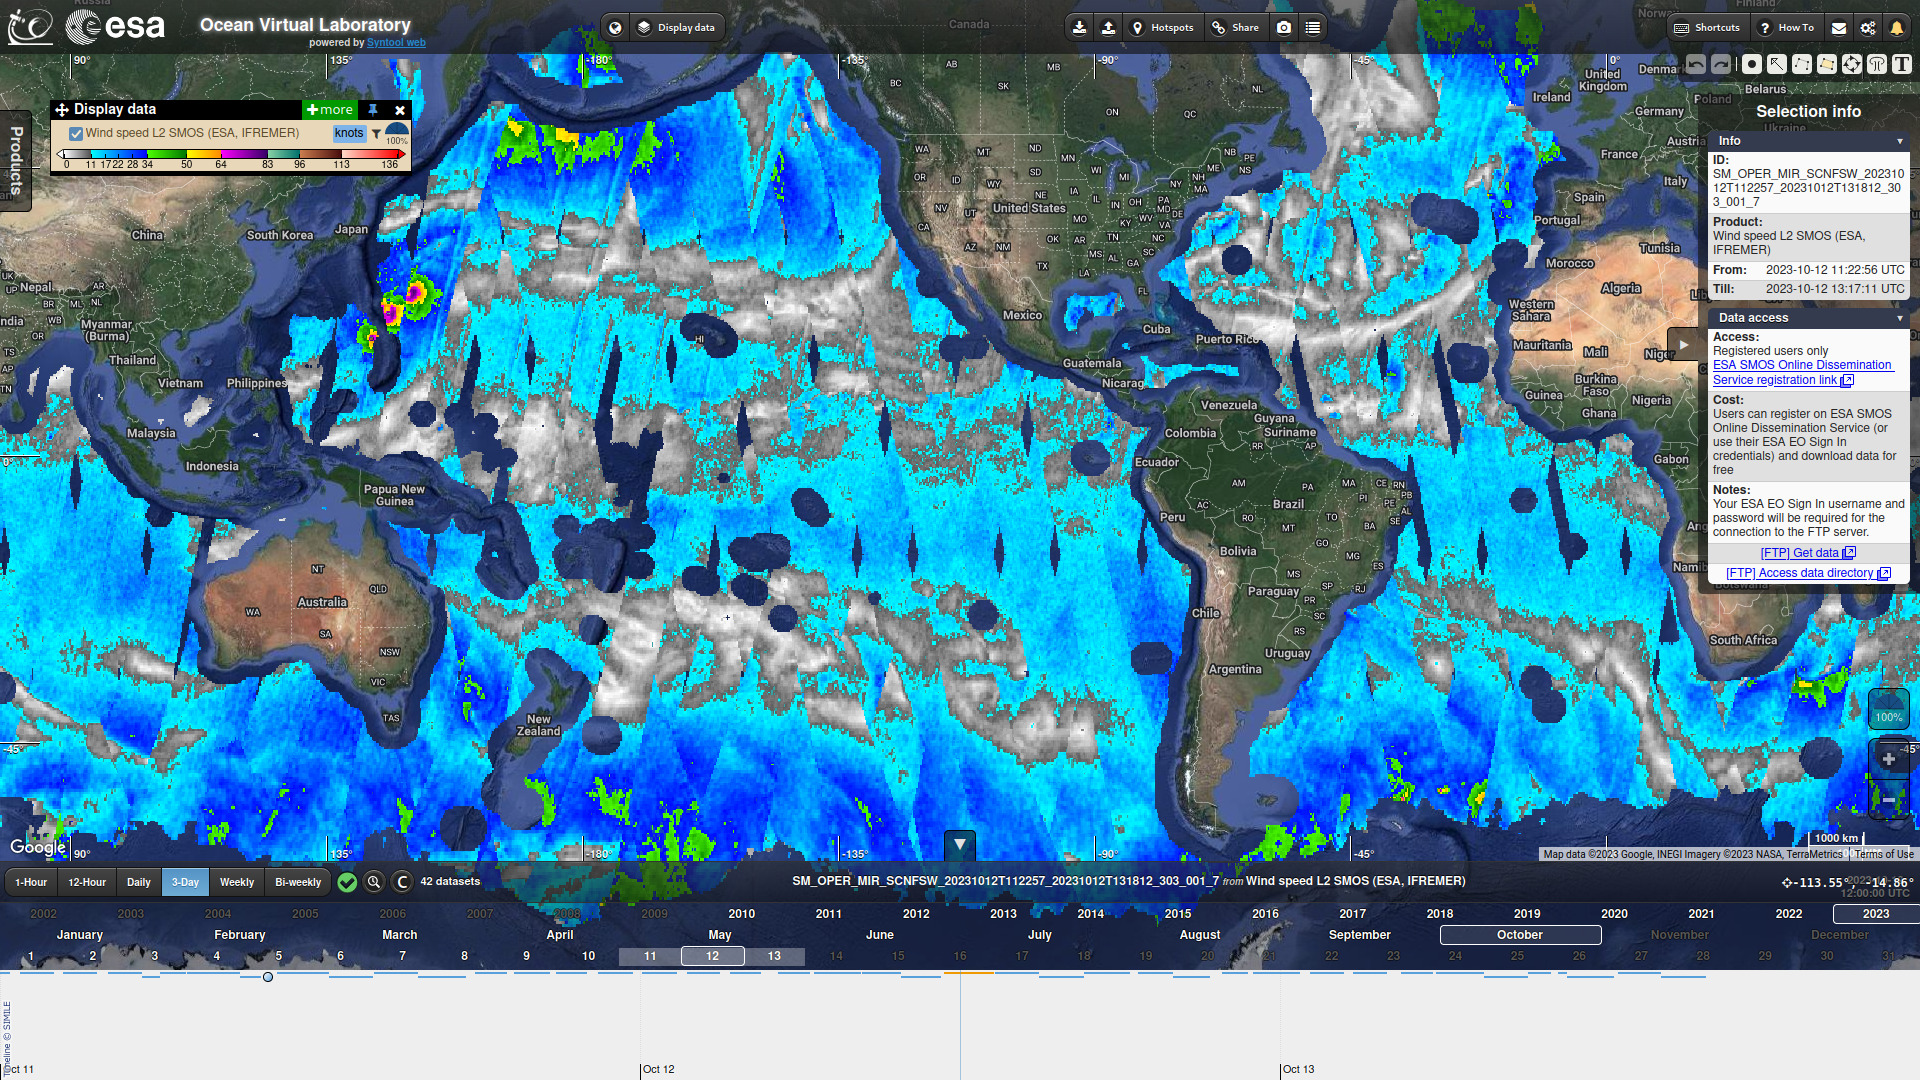
SMOS L2 wind NRT
The L2 product produced by the SMOS Wind Data Service has been added to our online visualisation portals.The whole data archive has been included using the reprocessed files (REPR) between January 2010 and May 2021, and the operational files (OPER) from June 2021 onward. New data are ingested as soon as they are detected by our processing chains (checking every hour).
Please note that satellite acquisitions from this product cannot be selected by clicking on the map, but selection is still possible if you expand the timeline control and click the acquisition's temporal coverage (blue line or dot, depending on the duration), allowing you to get more details, including a link to the original file.
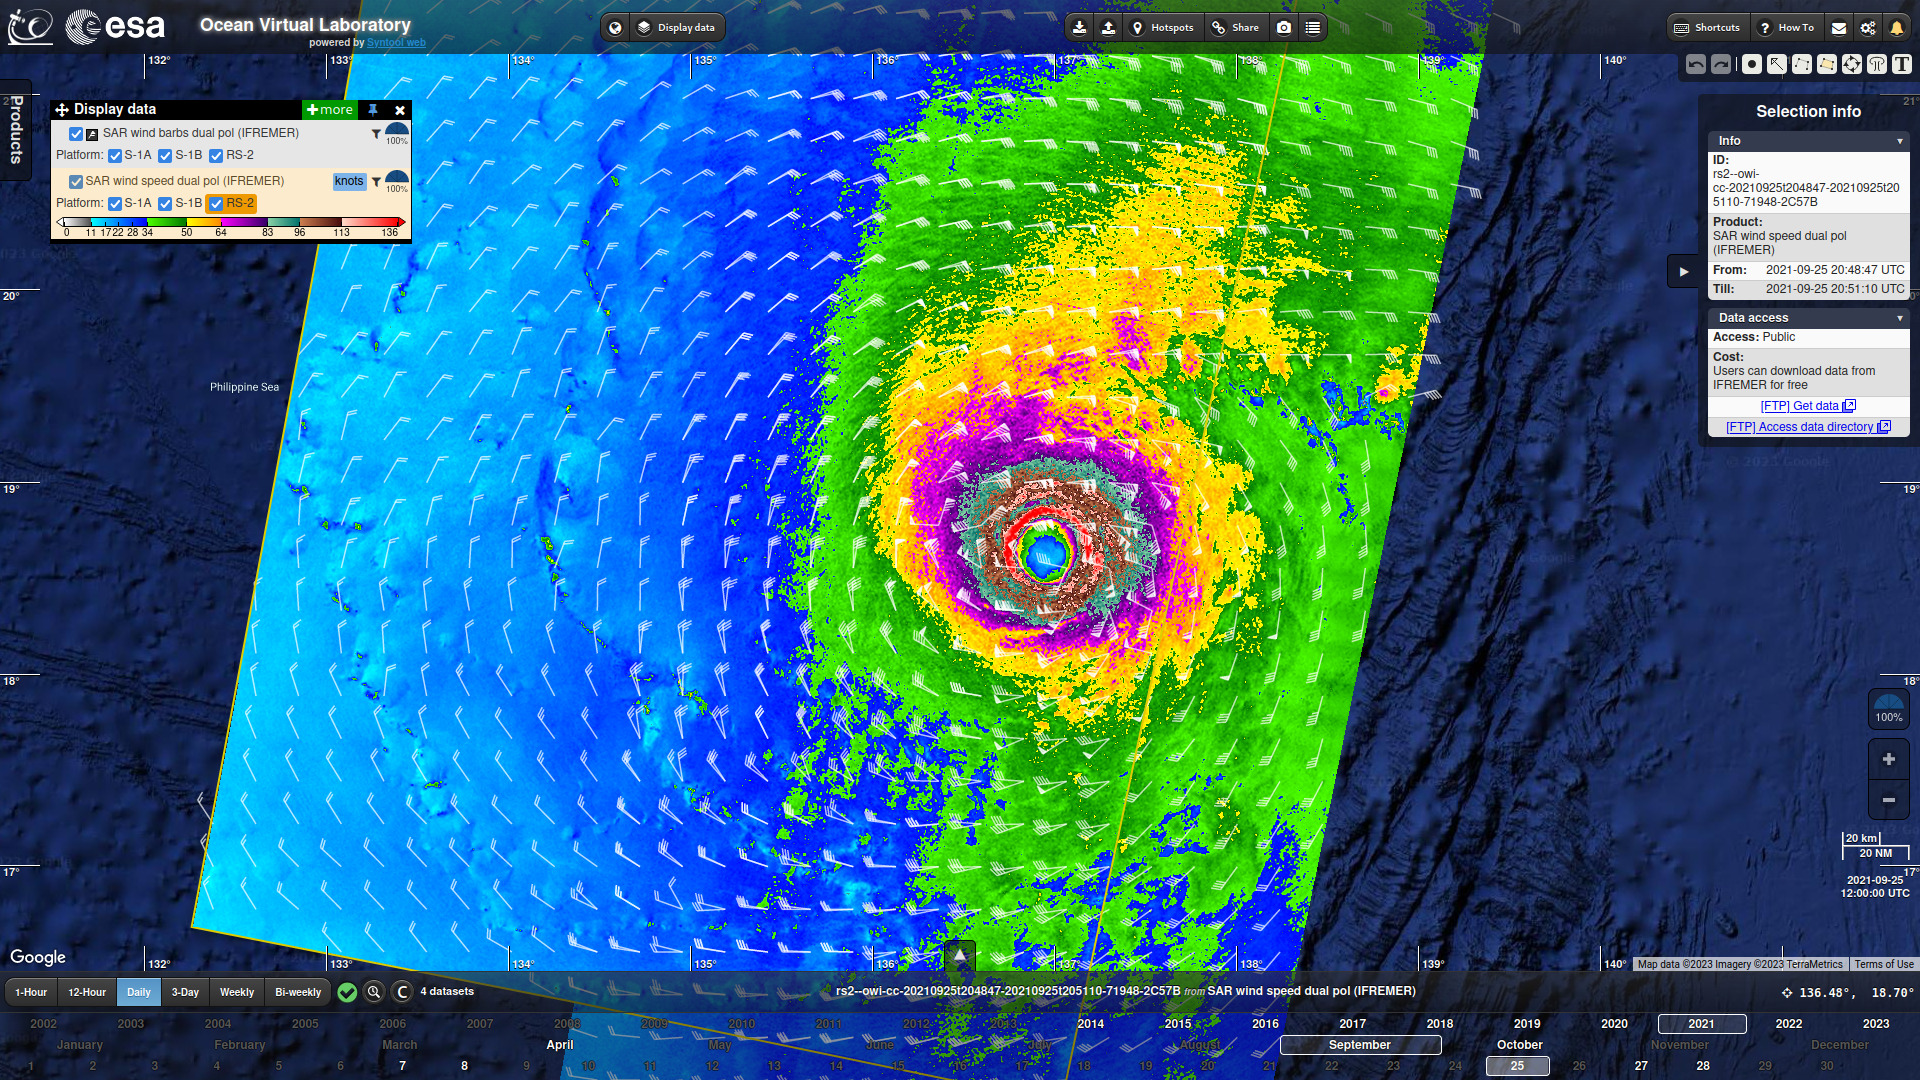
SAR L2C wind for tropical cyclones
Our portals also contained a wind product produced by IFREMER using SAR acquisitions. Until now we only processed the files originating from Sentinel-1 acquisitions, but the product also contains data derived from RadarSat-2 measurements.Previous results have been removed (at least from the OVL portal) and all the data available to this day (Sentinel-1 and RadarSat-2) have been processed with the new colormap.
This product is ingested automatically with a 48-hour delay to make sure the L2 files are fully consolidated when we process them (L1 used as input for the L2 wind production can be published a bit late and lead to incomplete scenes).
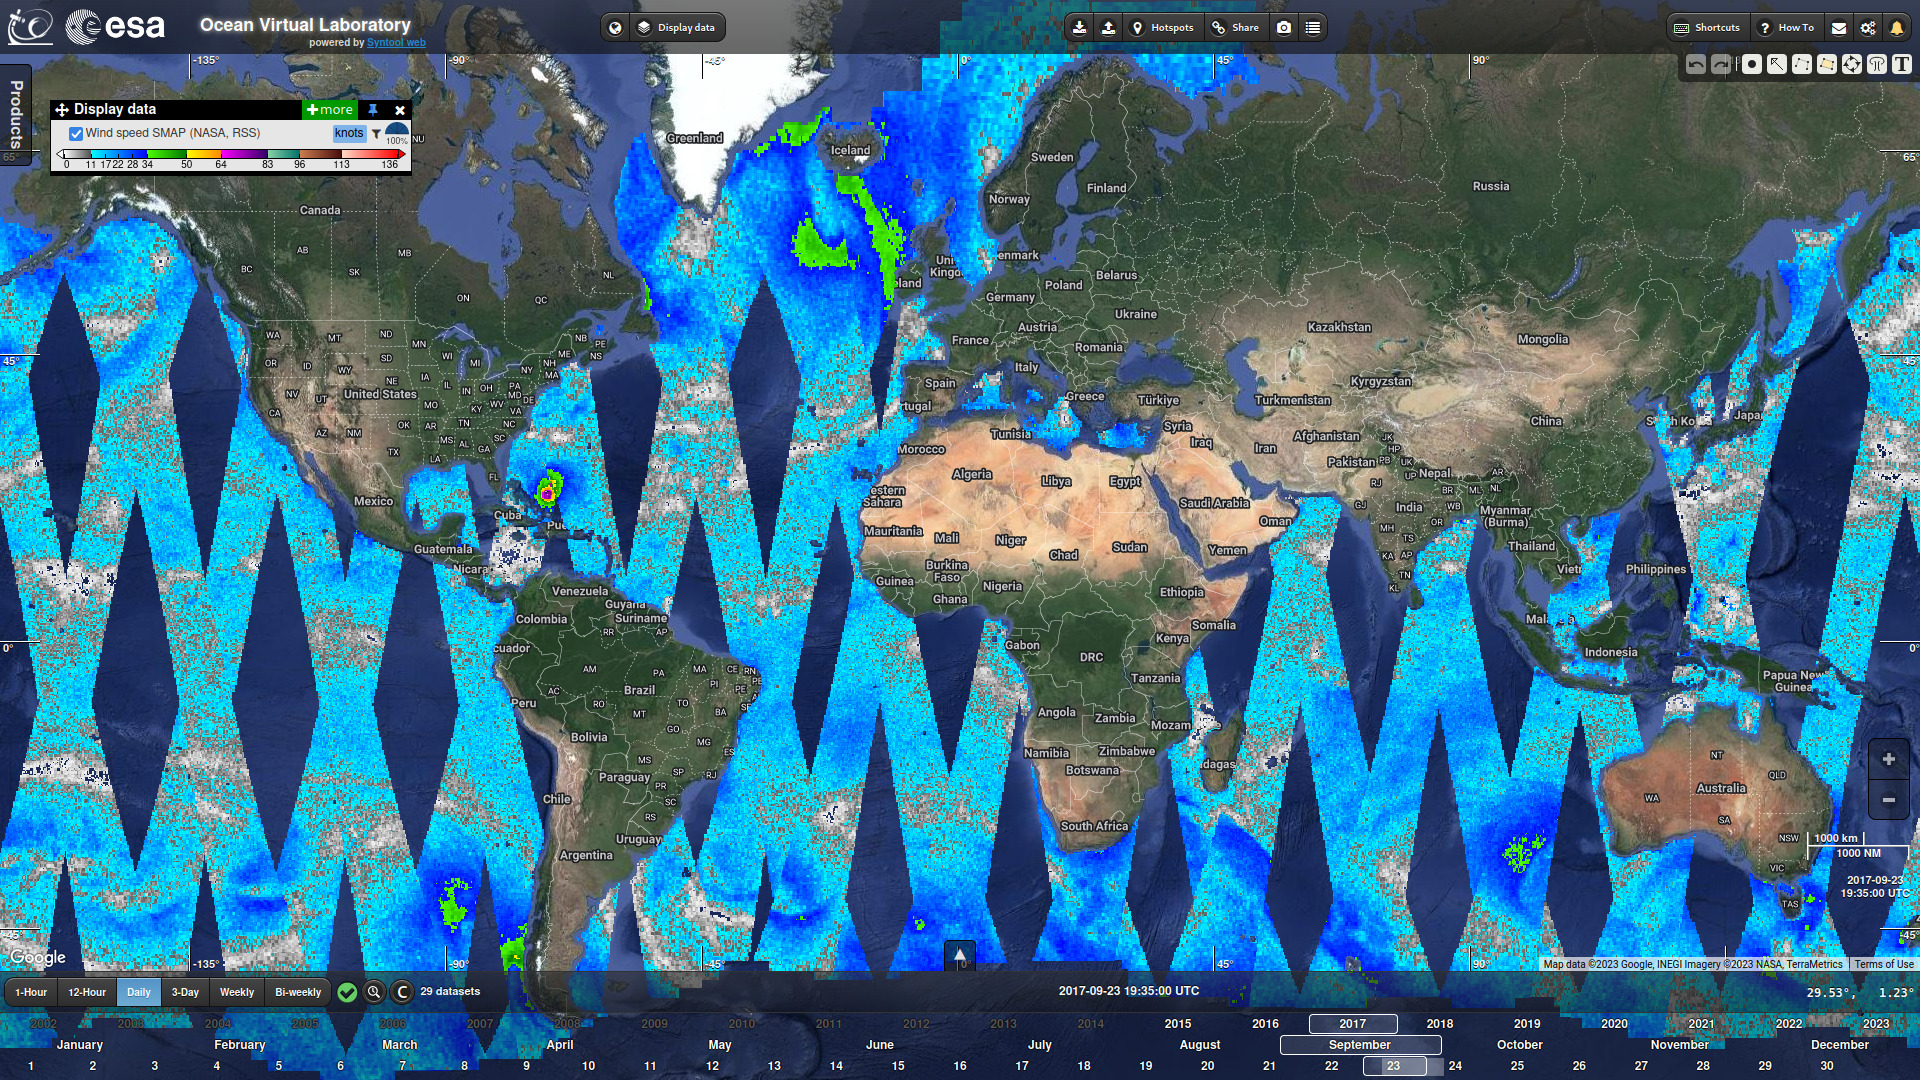
SMAP L3 wind NRT
We have been processing the SMAP L3 wind maps from Remote Sensing Systems for several years so we already had the complete product in our portals… but not with the new colormap.
Here again, the previous results have been removed (for the OVL portal) and the full data archive has been processed using the "final" version of the product from 2015 to 3rd May 2023, then the NRT version.
NRT files are built incrementally, so new data are processed with a 48-hour delay to avoid incomplete files.
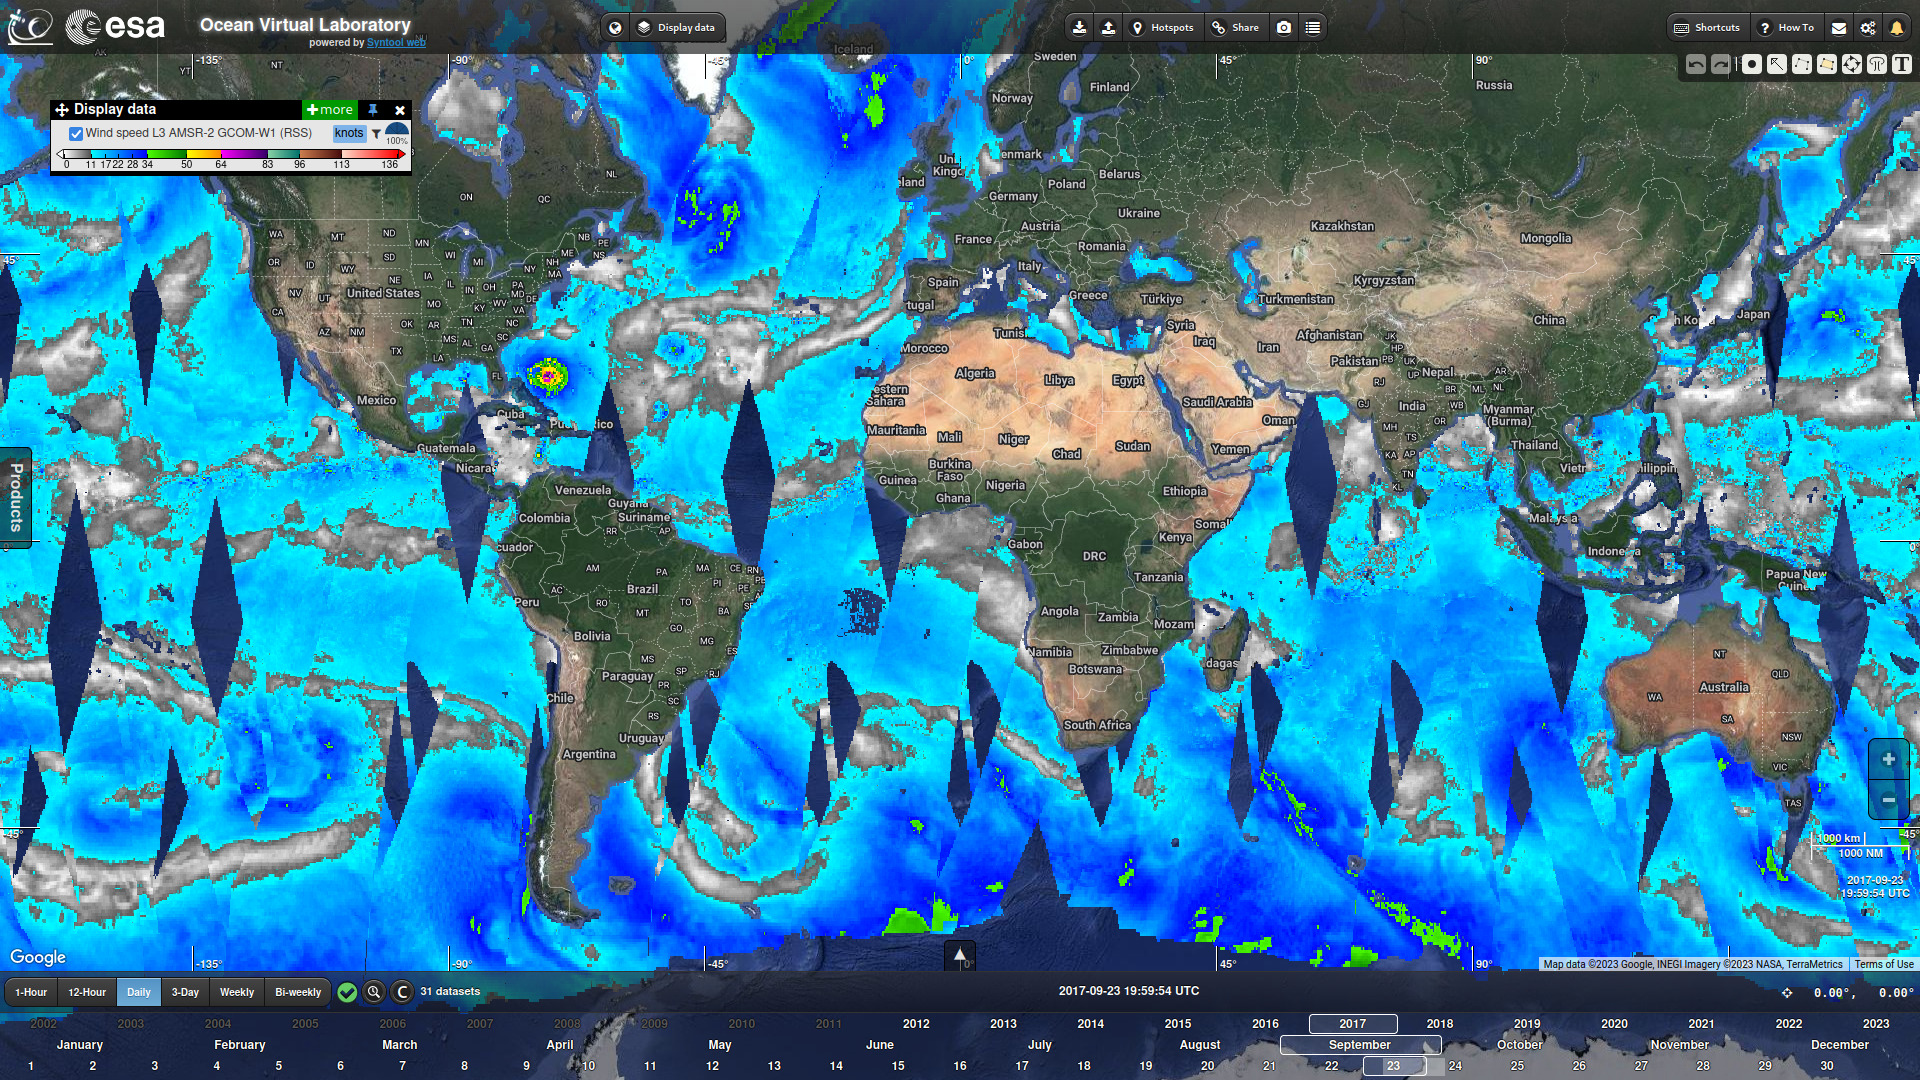
AMSR-2 L3 wind NRT
Remote Sensing System also provides an AMSR-2 L3 wind product and it is now available in the OVL portal.
The full data archive has been ingested using the "final" version of the product from 2012 to 9th October 2023, then the NRT version.
As with the SMAP product, NRT files are built incrementally, so new data are processed with a 48-hour delay to avoid incomplete files.
CyGNSS L2 wind
A few months ago we added a sample of CyGNSS L2 wind data (year 2020) but at that time we used a different colormap: in the OVL portal you can now visualise these data with the same colormap as the other products mentioned in this news :)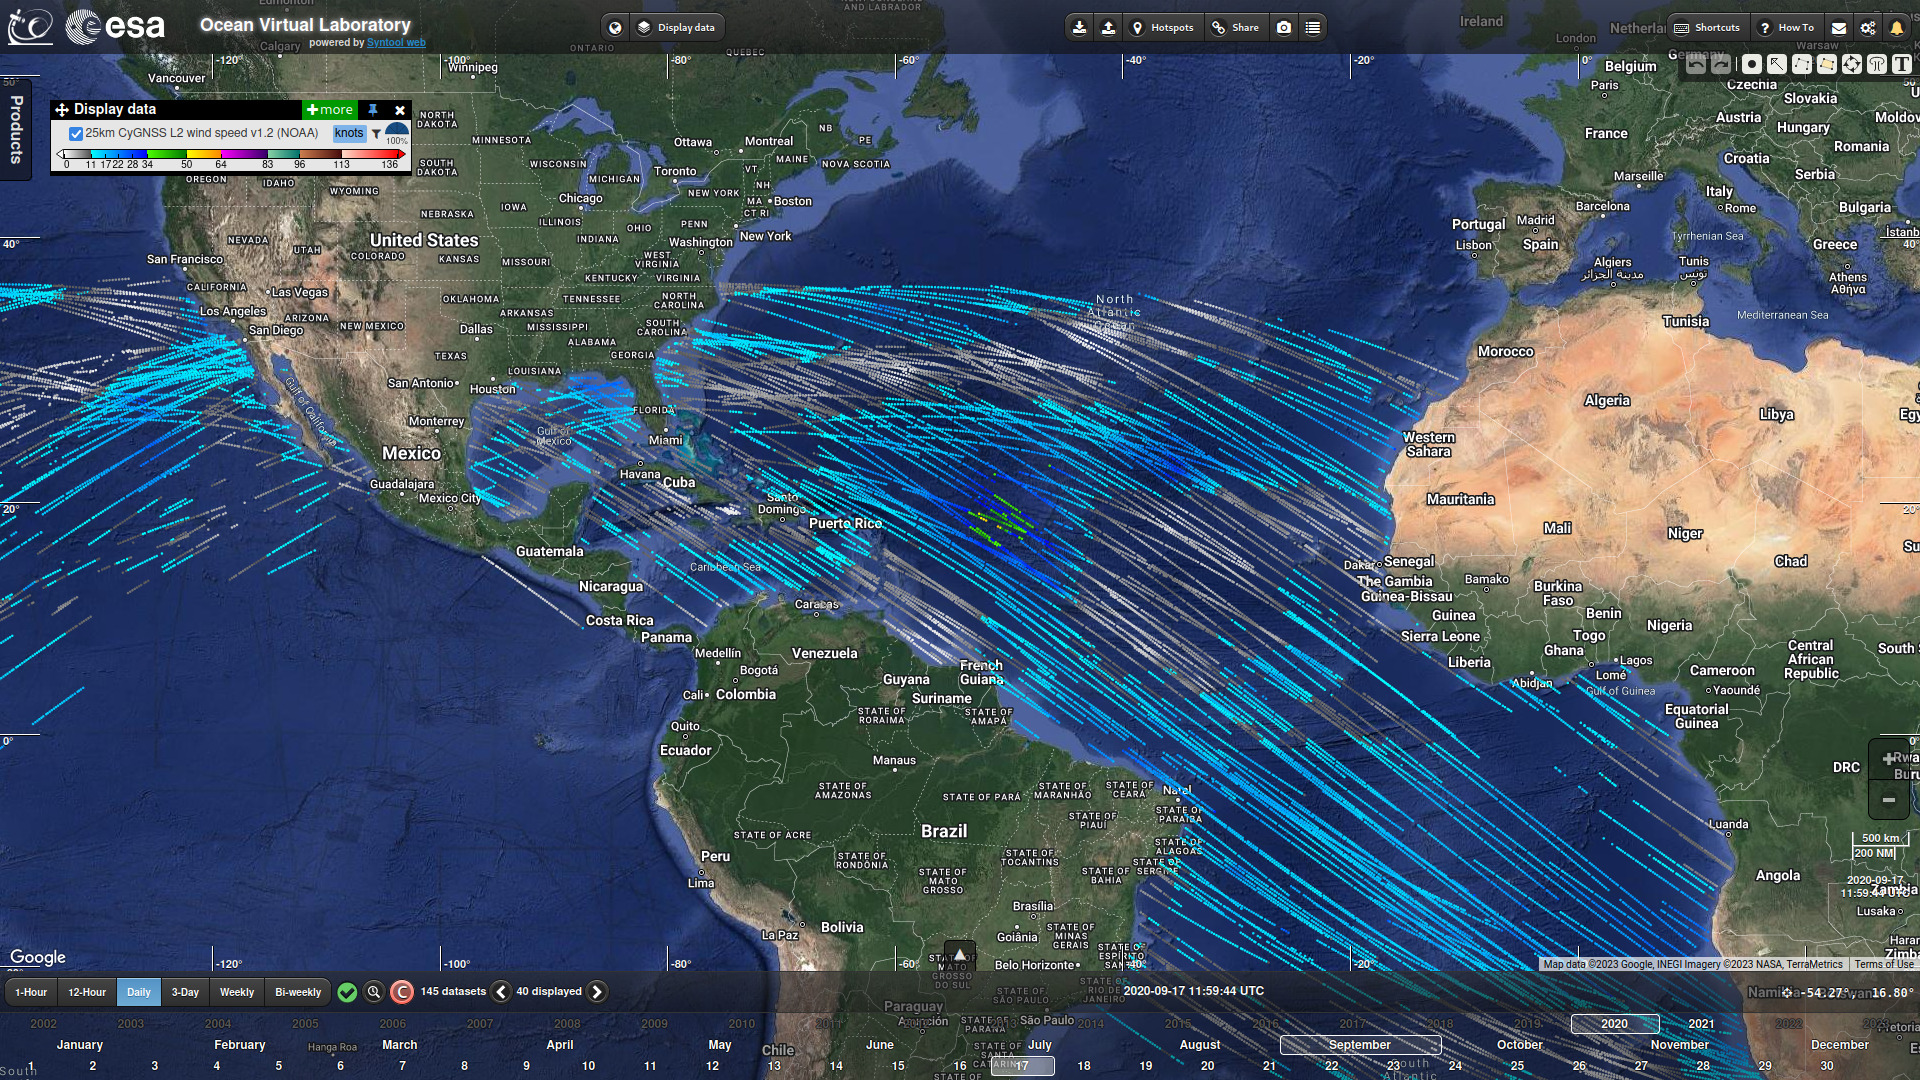
… and more!
In addition to the new products and data reprocessing, you may notice small changes in the user interface of our portals.
In Syntool it is possible to display only a subset of datasets (a.k.a. acquisitions, granules) by defining a pattern that is applied to dataset identifiers: datasets whose identifier matches the pattern are displayed on the map, the others are discarded.
This is particularly useful when visualising products composed of data from multiple platforms, such as products based on Sentinel satellites with A/B (and soon C/D) variants.
Users can apply their own patterns and filter results by clicking on the
 icon (between the product's units and the opacity gauge in the "Display data" menu), providing a pattern in the input field that appears and pressing Enter to validate.
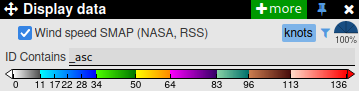
For example, the identifiers in the SMAP wind product conveniently include information regarding the direction of the pass: identifiers end with "_asc" for ascending passes and with "_desc" for descending passes. We can therefore apply a pattern to display only ascending passes:
The major issue with this mechanism is that the information included in identifiers can change from product to product, and they can be chosen arbitrarily so there is no surefire rule.
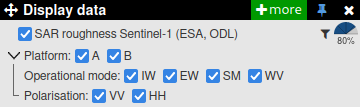
To make things easier, we added a few predefined filters based on this mechanism so that users can apply the most useful patterns without prior knowledge of the identifiers' structure.
For instance it is now possible to visualize Sentinel-1 SAR roughness for a specific platform, operational mode and polarization:
We hope you will find these new data and features useful :) Enjoy and let us know what you think (syntoolnobotplease oceandatalab.com)!