Download links available in Ocean Virtual Laboratory
by Ziad El Khoury Hanna, Sylvain Herlédan
- SST MicrowaveOI v5.0 (REMSS)
- SST Odyssea Regional North West Europe (IFREMER)
- SST Odyssea Regional Med Sea (IFREMER)
- SST Odyssea Regional South Africa (IFREMER)
- SST Odyssea Regional Brazil (IFREMER)
- SST Odyssea Global (IFREMER)
- SMAP Wind speed (NASA,RSS)
- Geostrophic surface current NRT streamlines (CMEMS)
- Total 15m current NRT streamlines (CMEMS)
- Total surface current NRT streamlines (CMEMS)
- AMSR sea ice concentration (JAXA,Uni Bremen)
- NIR contrast OLCI Sentinel-3A (ESA, OceanDataLab)
- OLCI specular sea surface angle map Sentinel-3A (OceanDataLab)
- OLCI Chlorophyll_a (oc4me) Sentinel-3A (ESA, OceanDataLab)
- SSHA 1Hz SRAL Sentinel-3A (Eumetsat)
- SWH SRAL Sentinel-3A (Eumetsat)
- SRAL Wind speed Sentinel-3A (Eumetsat)
- Sigma0 SRAL Sentinel-3A (Eumetsat)
- False Color SLSTR Sentinel-3A (ESA)
- Thermal infrared 12µ SLSTR Sentinel-3A (ESA)
- SST SLSTR Sentinel-3A (ESA, OceanDataLab)
- True color OLCI Sentinel-3B (ESA)
- NIR contrast OLCI Sentinel-3B (ESA, OceanDataLab)
- OLCI specular sea surface angle map Sentinel-3B (OceanDataLab)
- OLCI Chlorophyll_a (oc4me) Sentinel-3B (ESA, OceanDataLab)
- False Color SLSTR Sentinel-3B (ESA)
- Thermal infrared 12µ SLSTR Sentinel-3B (ESA)
- SST SLSTR Sentinel-3B (ESA, OceanDataLab)
- SSHA 1Hz SRAL Sentinel-3B (Eumetsat)
- SWH SRAL Sentinel-3B (Eumetsat)
- SRAL Wind speed Sentinel-3B (Eumetsat)
- Sigma0 SRAL Sentinel-3B (Eumetsat)
- Model wind wave partition (MFWAM Météo-France, CMEMS)
- Model wave 1rst spectral partition (MFWAM Météo-France, CMEMS)
- Model wave 2nd spectral partition (MFWAM Météo-France, CMEMS)
- Model significant wave height (MFWAM Météo-France, CMEMS)
- Model Stokes drift (MFWAM Météo-France, CMEMS)
- SWH Jason-3 NRT (CMEMS)
- Wind speed Jason-3 NRT (CMEMS)
- Jason-3 NRT Absolute Dynamic Topography (CMEMS)
- Jason-3 NRT Sea Level Anomaly (CMEMS)
- SWIM L2 Nadir nsec swh (CNES, CWWIC)
- SWIM L2 Nadir nsec wind (CNES, CWWIC)
- Sentinel-1A SAR roughness 2021-11/- (ESA, OceanDataLab)
- Sentinel-1A SAR 10m neutral wind speed 2021-11/- (ESA)
- Sentinel-1A SAR 10m neutral wind barbs 2021-11/- (ESA)
- Sentinel-1B SAR roughness 2021-11/- (ESA, OceanDataLab)
- Sentinel-1B SAR 10m neutral wind speed 2021-11/- (ESA)
- Sentinel-1B SAR 10m neutral wind barbs 2021-11/- (ESA)
Some of the files that we process may become unavailable after some time due to consolidation or reprocessing performed by the data provider, therefore direct download links can become obsolete. In such case the download links are not updated because our automated processing chains ingest the data only once, but we provide a link to the directory where you should be able to quickly find the new version of the file.
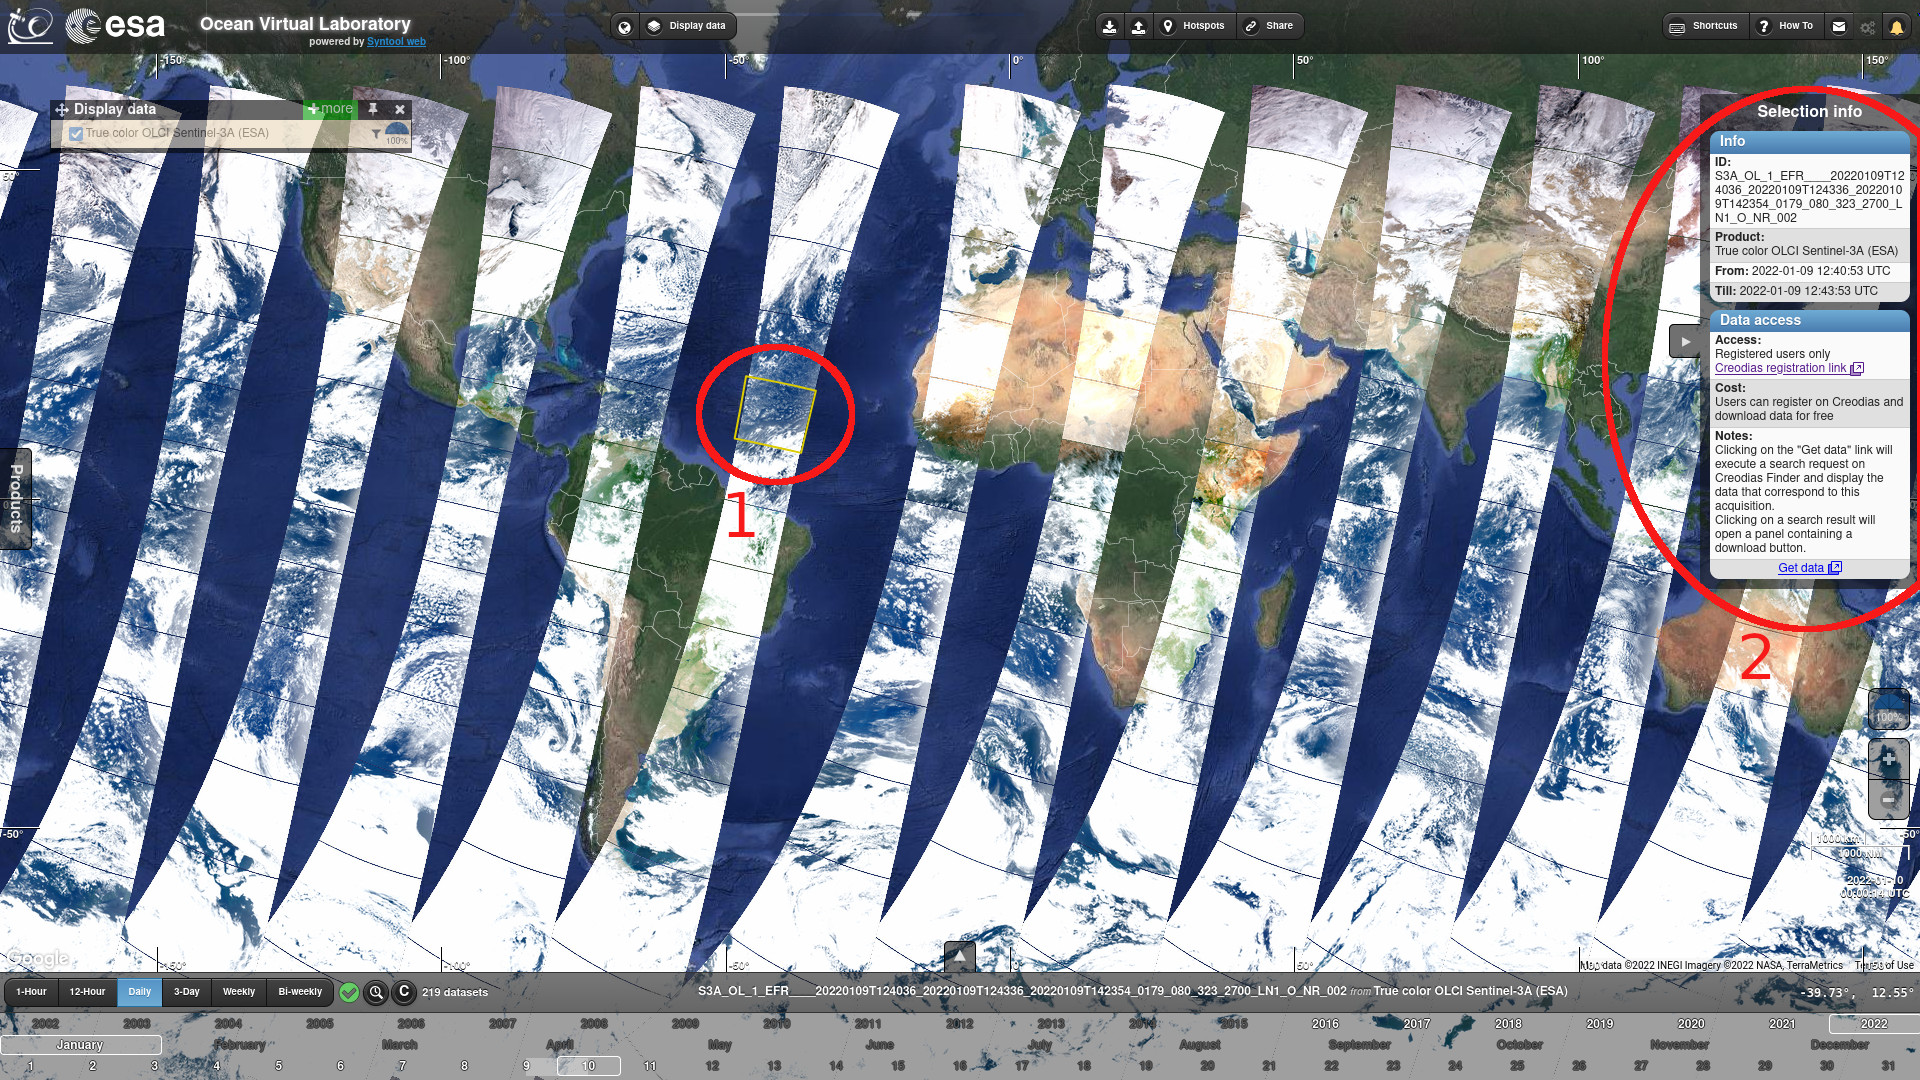
Data access information includes download links (direct link when possible), registration links (when relevant), as well as notes about how you can get access to the data in case the procedure is not trivial. These links and notes are displayed in the "Selection info" menu that appears on the right side of the screen when you select an acquisition/granule on the map:

1/ Select an acquisition/granule on the map.
2/ The "Selection info" menu containing a "Data access" section with notes and links
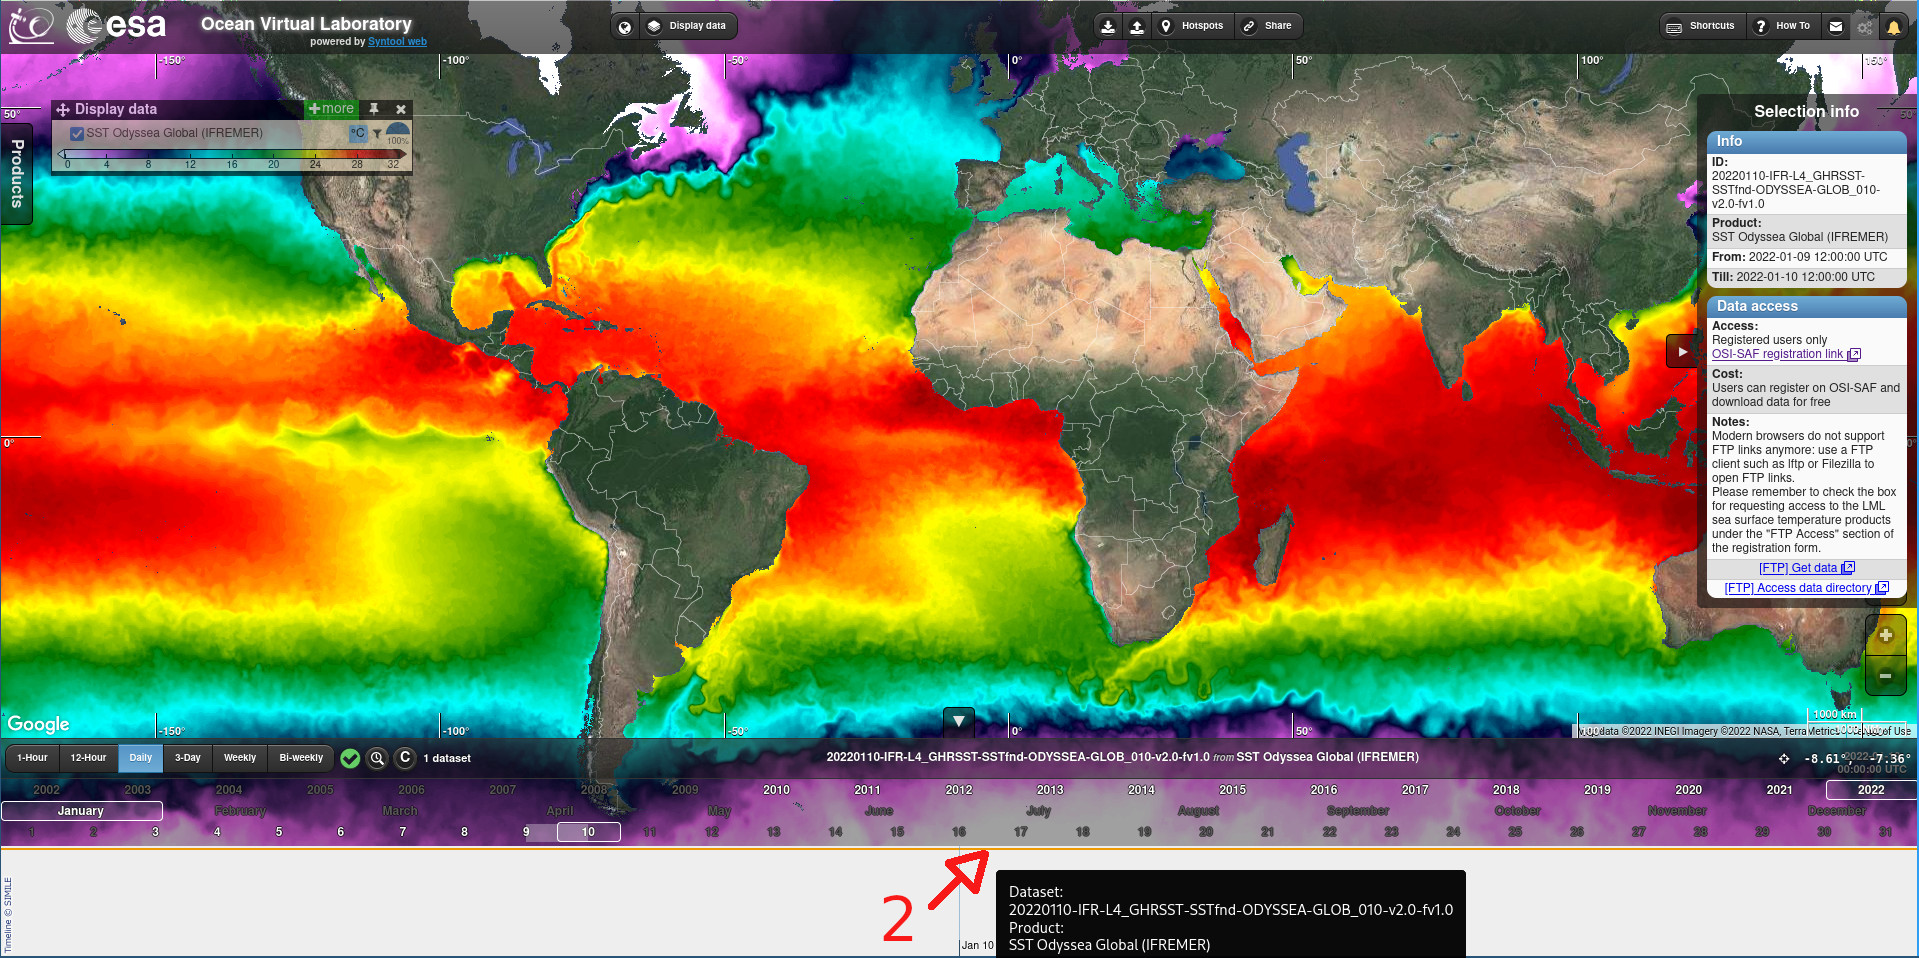
Please note that some acquisitions/granules cannot be selected directly on the map (global data for example), so you need to use the detailed timeline to select them.
In order to show the detailed timeline, first click on the "Up" arrow located just above the timeline component:

1/ Click on the "Up" arrow to extend the detailed timeline
Now that the detailed timeline has been extended, you can see that it contains lines representing the time coverage of each acquisition/granule that intersect the selected time window. For acquisitions/granules with a very short time coverage, the line is replaced by a dot to make it easier to spot and to interact with.
Placing the mouse cursor over a line or a dot in the detailed timeline will display some information about the associated acquisition/granule, so you can check.
Clicking on a line or a dot will select the associated acquisition/granule and the "Selection info" menu will appear on the right side of the screen with the data access links (if available) and other information:

2/ Click on the line (or the dot) representing the acquisition/granule time coverage to select it and open the "Selection info" menu
Let us know what you think about this new feature and don't hesitate to contact us (on the forum or by email at syntoolnobotplease oceandatalab.com) if you have questions about data access in OVL!