17 November 2015 - Ocean Virtual Laboratory training course
IOPAN, Sopot, Poland
by Dr.fab
Nov 17, 2015. Ocean Virtual Laboratory training course at IOPAN, Sopot, Poland : General information about the training course
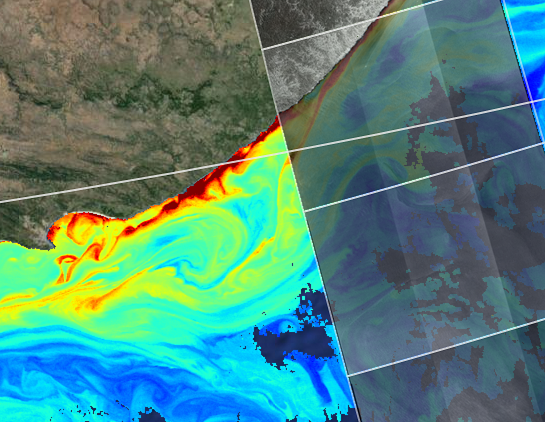
Exploring synergies amongst Ocean Remote Sensing datasets (here Ocean Surface roughness and Sea Surface Temperature)
how to :
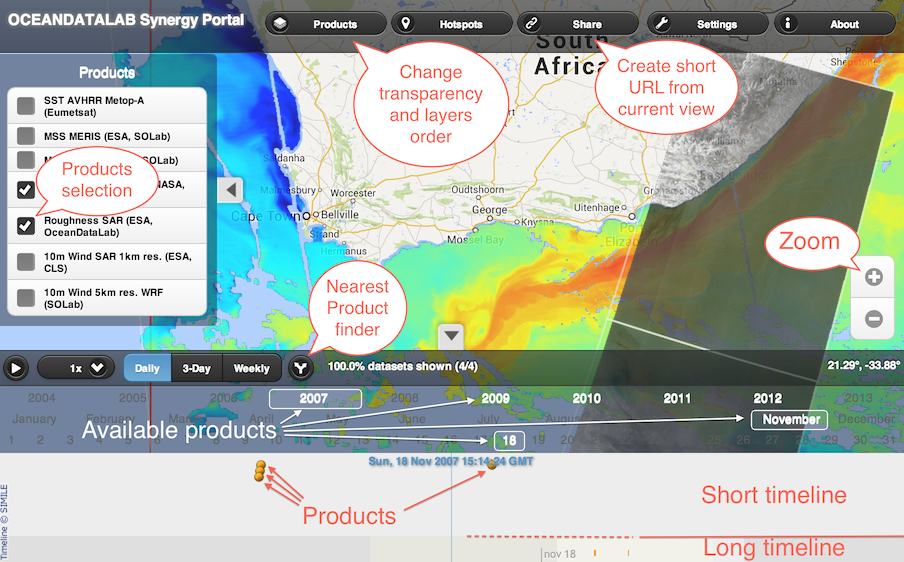
To select a particular product you can click on it on the map or in the timeline and you can play on its transparency with the keyword ( Shift + P and M keys)
- SAR roughness and altimeter surface current
- Identify surface current direction from biogenic film elongation and check consistency with altimeter surface current direction.
- Cross check surface current direction from SAR with the direction of SST gradients.
- MERIS/MODIS MSS on gulf stream
- Select MSS MERIS product only (unselect MSS MODIS and SST MODIS)
- Zoom to find an oil spill at location around Lon -79.1 / Lat 31.0
- Add MSS MODIS product and play with transparency to see the oil spill on MERIS and MODIS.
- Press Shift+T then click on « transect »
- Draw a line between two consecutive observations of the same oil spill holding the Ctrl key to measure the distance.
- Find the sensing time difference between measurements in the short timeline.
- Estimate the surface current velocity in the Gulf Stream
- Alternatively you can click on the « extract » button, draw a bounding box while holding the Ctrl key and then click on the star over the zoom control to download all layers within the bounding box and analyse them in external image processing software.
- SAR roughness and MODIS SST
- Locate front visible both in SAR roughness and SST gradients by playing with transparency
- Estimate distance between front on SAR and SST
- Estimate surface current using the sensing time difference from the timeline
- MODIS Terra and Aqua MSS on gulf stream
- Click on the map to select the first layer
- Play with P and M keys to switch from MODIS Terra to MODIS Aqua
- Identify small eddy near Lon -78.6 Lat 31.3 (it is colder so you can look MODIS SST to help identify it
- Press Shift+T then click on « Numpy »
- Draw a line between two consecutive observations of the same oil spill holding the Shift key to draw a extraction box. Then click on the wheel on the right to get the link to numpy file.
- Estimate distance between eddy position on Terra and Aqua using ipython notebook corr.ipynb
- Estimate eddy transport velocity using sensing time difference from the timeline