20-24 June 2016, Summer School on Ocean Remote Sensing Synergy
Moulin-Mer, Logonna Daoulas (France)
by Cécile SALAUN
You can find more information on the Summer School website : http://conferences.telecom-bretagne.eu/synergy_summer_school_2016
Aim of the summer school:
This year, the Summer School will focus on the underlying physical framework for Ocean Remote Sensing Synergies interpretation. Lectures by invited speakers will provide both a broad coverage of oceanic modeling (e.g., surface quasi geostrophy, Lagrangian methods) and applications to multi-sensor/multi-tracer ocean sensing data (e.g., data assimilation, missing data interpolation). Each lecture will include a Python practical session with application to multi-sensor ocean remote sensing data, especially satellite-derived Sea Surface Salinity (SSS), Temperature (SST) and Height (SSH).Invited speakers:
- Prof. Ibrahim Hoteit (KAUST, Saudi Arabia)
- Prof. Joe Lacasce (WHOI & University of Oslo, Norway)
- Dr. Aurélien Ponte (IFREMER, France)
- Dr. Nicolas Reul (IFREMER, France)
Permanent speakers:
- Dr. Bertrand Chapron (IFREMER, France)
- Dr. Fabrice Collard (OceanDataLab, France)
- Dr. Pierre Tandeo (Telecom Bretagne, France)
- Dr. Jean Tournadre (IFREMER, France)
Program
The Summer School will include five main lectures:Lecture 1 –> Introduction to spatial oceanography (data acquisition, overview, problematic)
Lecture 2 –> Visualization tools for multi-sensor spatio-temporal remote sensing data
Lecture 3 –> Focus on satellite salinity (acquisition, problematic, synergy with altimetry)
Lecture 4 –> Physical modeling (surface quasi-geostrophy, Lagrangian methods)
Lecture 5 –> Data assimilation methods (state-space models, Ensemble Kalman Filter)
Each lecture will include both a theoretical course and a practical session with applications to multi-sensor remote sensing or physical simulation datasets. A poster session will provide opportunities for the participants to introduce and discuss their research interests with the other participants and the speakers.
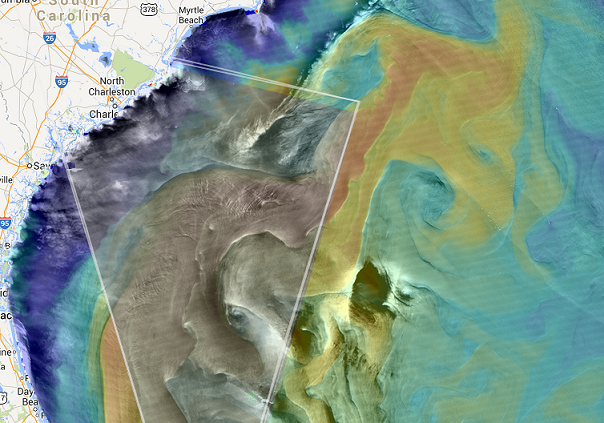
Tuesday June 21 at 9:00 : Practice using syntoolweb
Exploring synergies amongst Ocean Remote Sensing datasets (here Ocean Surface roughness and Sea Surface Temperature)
to select a particular product you can click on it on the map or in the timeline and you can play with its transparency with the keyword ( Shift + P and M keys)
- MERIS/MODIS MSS on gulf stream
- select MSS MERIS products only (unselect MSS MODIS and SST MODIS)
- zoom to find an oil spill at location around Lon -79.1 / Lat 31.0
- add MSS MODIS product and play with transparency to see the oil spill on MERIS and MODIS.
- Press Shift+T then click on « transect »
- Draw a line between two consecutive observations of the same oil spill holding the Ctrl key to measure the distance.
- Find the sensing time difference between measurements in the short timeline.
- Estimate the surface current velocity in the Gulf Stream
- Alternatively you can click on the « extract » button, draw a bounding box while holding the Ctrl key and then click on the star over the zoom control to download all layers within the bounding box and analyse them in
- external image processing software.
- MODIS Terra and Aqua MSS on gulf stream
- click on the map to select the first layer
- play with P and M keys to switch from MODIS Terra to MODIS Aqua
- identify small eddy near Lon -78.6 Lat 31.3 (it is colder so you can look at MODIS SST to help identify it
- Press Shift+T then click on « Numpy »
- Draw a line between two consecutive observations of the same oil spill holding the Shift key to draw an extraction box. Then click on the wheel on the right to get the link to numpy file.
- estimate distance between eddy position on Terra and Aqua using ipython notebook corr.ipynb
- estimate eddy transport velocity using sensing time difference from the timeline
- SAR roughness and MODIS SST
- locate front visible both in SAR roughness and STT gradients by playing with transparency
- estimate distance between front on SAR and SST
- Estimate surface current velocity using the sensing time difference from the timeline.
- Other exemples with Sentinel1 SAR roughness and VIIRS SST