4th ESA Advanced Ocean Remote Sensing Training Course in IFREMER, Brest, sept 7-11 2015
by dr.fab
Dr.fab from OceanDataLab, together with Romain Husson from CLS gave the hands on training on SAR marine applications.
In particular, they demonstrated some processing techniques to estimate geophysical parameters such as sea surface roughness, cross spectra or azimuth cutoff, and then the synergies amongst SAR and other Ocean Remote Sensing datasets (here Ocean Surface roughness and Sea Surface Temperature)
Geophysical parameters estimation
The training was based on the following self described ipython notebooks and making use of some open source SAR processing and data reader libraries :notebook 1 : nice display (incidence angle compensation)
notebook 2 : SAR cross spectra estimation
notebook 3 : SAR azimuth cutoff
notebook 4 : SAR wind speed estimation
OceanDataLab SAR processing library (for notebooks 1-2-3)
IFREMER / CERSAT Cerbere geospatial processing library (for notebooks 1-2-3)
Nansat / OpenWind (for notebook 4)
Synergy demonstration
how to :
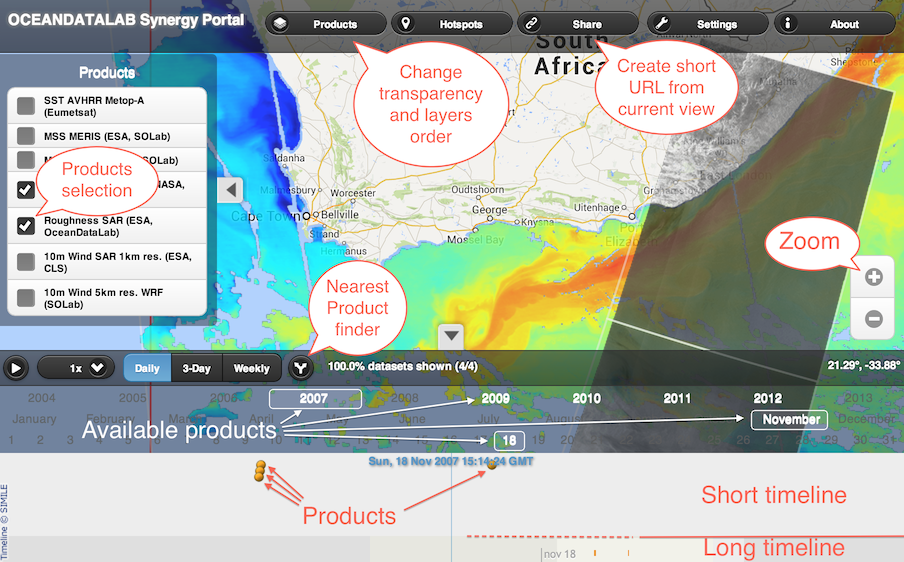
To select a particular product you can click on it on the map or in the timeline and you can play with its transparency with the keyword ( Shift + P and M keys)
- SAR roughness and altimeter surface current
- Identify surface current direction from biogenic film elongation and check consistency with altimeter surface current direction.
- Cross check surface current direction from SAR with the direction of SST gradients.
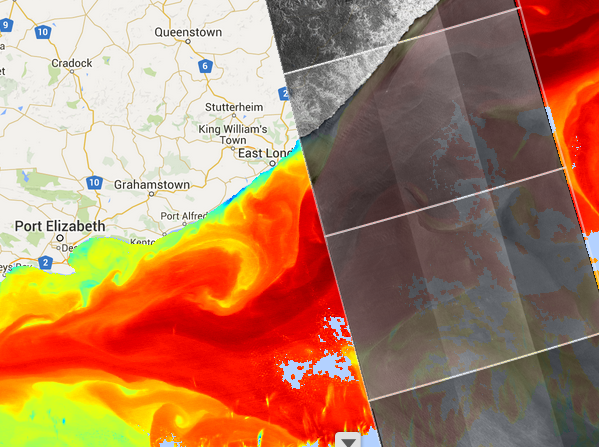
- SAR roughness and MODIS SST
- Locate front visible both in SAR roughness and SST gradients by playing with transparency
- Estimate distance between front on SAR and SST
- Estimate surface current using the sensing time difference from the timeline.
- Another exemple with Sentinel1 SAR and VIIRS SST
- SAR roughness and VIIRS Ocean Color
- Identify signature of high chl-a concentration on surface roughness
- SAR cross spectra and model wave partitions
- Identify peaks in the SAR cross spectra and dominant model wave vectors
- SAR 10m wind and ECMWF model wind
- Look at the variability of SAR wind compared to the mean model wind speed.
- SAR wave modulation in the Marginal Ice Zone
- Look at the swell modulation of radar backscatter signature at the crossing from open ocean to sea ice in the Marginal Ice Zone.
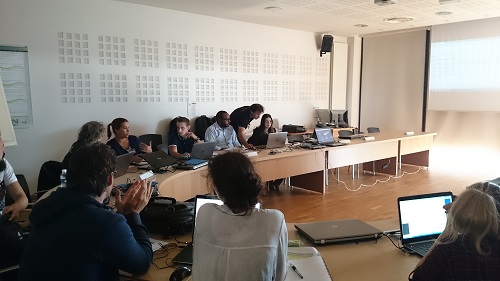
The training was organized by ESA, and was held on Ifremer's site. More than fifty people attended presentations and demonstrations.
Half of the participants came from countries of the European Union. The others were from every continent. The audience was made up of doctors and PhD students.
Fifteen lecturers intervened, coming from companies like Brockmann Consult GmbH, CLS, Ocean Data Lab, or even organizations like Ifremer, Plymouth NOC, the NERSC, or ESA.
The demonstration by Fabrice Collard and Romain Husson was interesting : students gave a good feedback.
Thank you to the LOS team of Ifremer for the organization of this event.