Taking advantage of Multisensor Synergy: new discovery and analysis tools

Context:
A wide variety of sensors are available at a resolution that has never been better. To intercompare and benefit from the synergy of all these data in their native geometry and format can be challenging. Handling this huge heterogeneous dataset easily is now possible using the OceanVirtualLab tools presented here: the online OceanVirtualLab (OVL) portal, and the Stand-alone SEAScope application.

Online OceanVirtualLab portal

The OVL portal is an online visualisation tool for exploring EO data sets

  • Free and Open Source (JavaScript/Python, based on Syntool software)
  • Pre-generated images (projection + tiling) for faster data loading
  • Access to distributed data servers
  • Basic drawing and annotation capabilities
  • Available on https://ovl.oceandatalab.com

Thematic portals are also available:

Standalone SEAScope interactive application

SEAScope is a 3D data visualisation and analysis software

  • Free and Open Source (C++/OpenGL/Python)
  • Multiplatform: Linux, macOS and Windows versions
  • Easy installation: grab the archive, extract its content, done!
  • Data rendered dynamically on 3D Earth: more rendering options, no projection-induced limitations
  • Embedded local data server: you can add your own data
  • Basic drawing and annotations capabilities
  • Data extraction on screen pixels grid: automatic colocation!
  • Bi-directional communication with external software (Python bindings provided)
  • Available on https://seascope.oceandatalab.com

These tools are already widely used by the scientific community. Illustrations of possible use cases of both online and standalone tools are shown below:

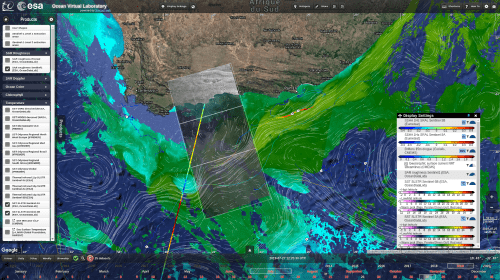
Synoptic chart of the upper ocean dynamics

Basic drawing capabilites are available, shapes can be imported and exported in JSON/GeoJSON/KML. It can be used to build training datasets for machine learning algorithms and provide guidance for ship routing.

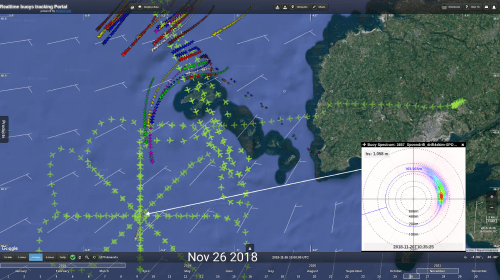
Realtime visualisation of campaign at sea

Dedicated online portal has been set up for planning the DRIFT4SKIM campaign, monitoring the deployment in real time and analysing results. This has been useful to adapt the in-situ/airborne colocation in real time.

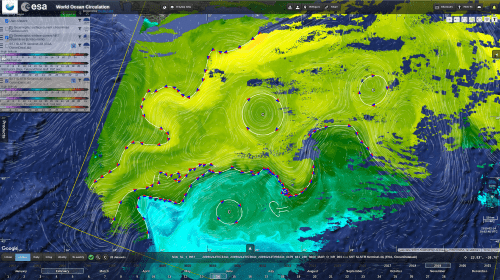
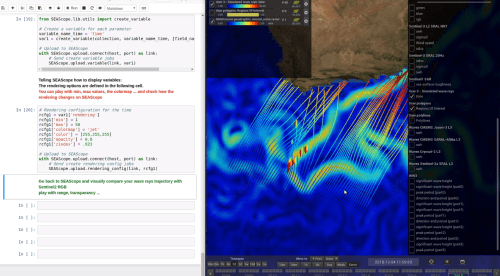
Wave current interaction simulation

Ocean current data are selected and extracted in SEAScope, used in a Jupyter python notebook to simulate wave current interaction and resulting waves rays are viewed in SEAScope together with contextual datasets.

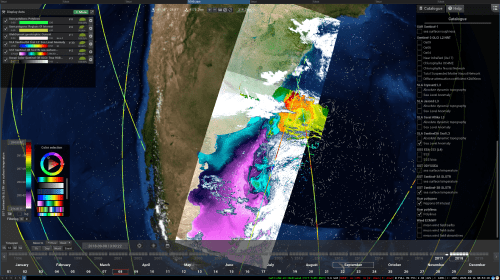
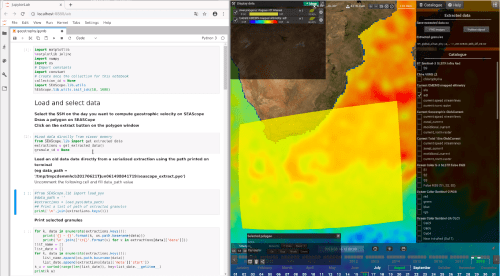
Geostrophic currents computation

Sea level data are extracted in SEAScope, sent to a Jupyter python notebook. Geostrophic currents are derived from the exported data, analysed and sent back to SEAScope to be compared with other currents or in-situ data.